Preliminary Data For India's Merchandise Trade As Of January 2022

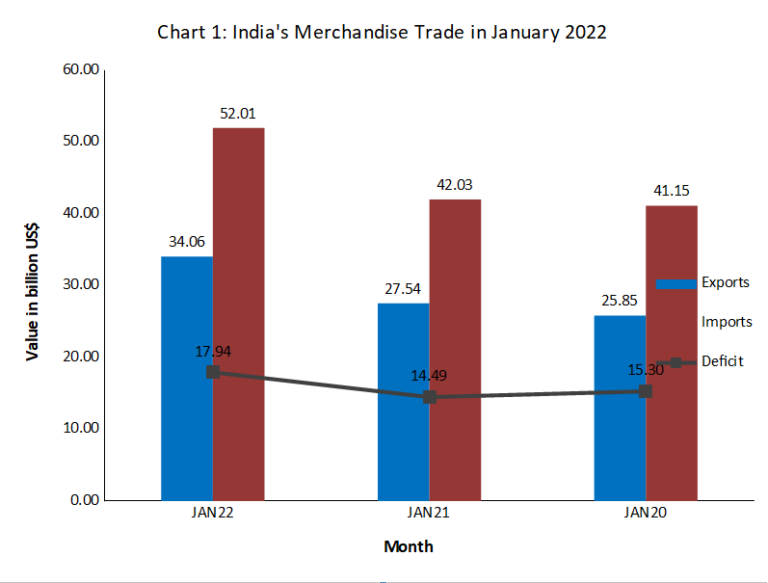
India exported USD 34.06 billion worth of goods in January
2022, up 23.69% from USD 27.54 billion in January 2021 and up 31.75% from USD
25.85 billion in January 2020.
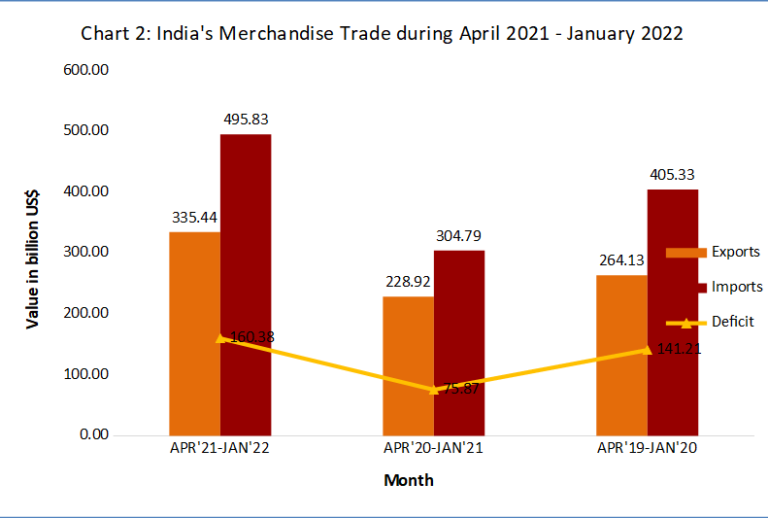
India's merchandise exports in 2021–22 (April–January) was
USD 335.44 billion, up 27.0% from USD 264.13 billion in 2019–20 and up 46.53%
from USD 228.9 billion in 2020–21 (April–January) (April-January).
India imported USD 52.01 billion worth of goods in January
2022, up 23.74% from USD 42.03 billion in January 2021 and 26.38% from USD
41.15 billion in January 2020.
India imported USD 495.83 billion worth of goods in 2021–22
(April–January), up 22.3% from USD 405.33 billion in 2019–20 and USD 304.79
billion in 2020–21 (April–January) (April-January).
In January 2022, the trade deficit was 17.94 billion USD,
compared to 160.38 billion USD in 2021–2022 (April-January).
|
Statement 1: India’s Merchandise Trade in January 2022 |
|||||
|
|
Value in Billion USD |
% Growth |
|||
|
Jan-22 |
Jan-22 |
Jan-22 |
Jan-22 |
Jan-22 |
|
|
Exports |
34.06 |
27.54 |
25.85 |
23.69 |
31.75 |
|
Imports |
52.01 |
42.03 |
41.15 |
23.74 |
26.38 |
|
Deficit |
17.94 |
14.49 |
15.30 |
23.82 |
17.30 |
|
Statement 2: India’s Merchandise Trade in 2021-22 (April-January) |
|||||
|
|
Value in Billion USD |
% Growth |
|||
|
|
2021-22 (Apr-Jan) |
2021-22 (Apr-Jan) |
2021-22 (Apr-Jan) |
2021-22 (Apr-Jan) |
2021-22 (Apr-Jan) |
|
Exports |
335.44 |
228.90 |
264.13 |
46.53 |
27.0 |
|
Imports |
495.83 |
304.79 |
405.33 |
62.68 |
22.30 |
|
Deficit |
160.38 |
75.87 |
141.2 |
112.97 |
13.51 |


A positive growth of 19.4% over non-petroleum exports of USD
25.4 billion in January 2021 and a positive growth of 33.81% over non-petroleum
exports of USD 22.67 billion in January 2020 was seen in the value of
non-petroleum exports, which in January 2022 totaled USD 30.33 billion. The
value of non-petroleum imports increased by 24.44% over non-petroleum imports
of USD 32.61 billion in January 2021 and by 44.19% over non-petroleum imports
of USD 28.14 billion in January 2020 to reach USD 40.57 billion in January
2022.
|
Statement 3: Merchandise Non-POL Trade in January 2022 |
|||||
|
|
Value in Billion USD |
% Growth |
|||
|
|
Jan-22 |
Jan-22 |
Jan-22 |
Jan-22 |
Jan-22 |
|
Exports |
30.33 |
25.40 |
22.67 |
19.40 |
33.81 |
|
Imports |
40.57 |
32.61 |
28.14 |
24.44 |
44.19 |
Non-petroleum exports totaled USD 287.84 billion in 2021–22
(Apr–Jan), up 37.59% from USD 209.19 billion in 2020–21 (Apr–Jan) and up 25.8%
from USD 228.8 billion in 2019–20. (Apr-Jan).
The total value of non-petroleum imports during April to
January 2021–22 was USD 366.14 billion, up 51.67% from April to January non-oil
imports of USD 241.41 billion in 2020–21 and up 23.86% from non-oil imports of
USD 295.61 billion in 2019–20. (Apr-Jan).
|
Statement 4: Merchandise Non-POL Trade 2021-22 (Apr-Jan) |
|||||
|
|
Value in Billion USD |
% Growth |
|||
|
|
2021-22(Apr-Jan) |
2021-22(Apr-Jan) |
2021-22(Apr-Jan) |
2021-22(Apr-Jan) |
2021-22(Apr-Jan) |
|
Exports |
287.84 |
209.19 |
228.80 |
37.59 |
25.8 |
|
Imports |
366.14 |
241.41 |
295.61 |
51.67 |
23.86 |
Non-petroleum exports totaled USD 287.84 billion in 2021–22
(Apr–Jan), up 37.59% from USD 209.19 billion in 2020–21 (Apr–Jan) and up 25.8%
from USD 228.8 billion in 2019–20. (Apr-Jan).
The total value of non-petroleum imports during April to
January 2021–22 was USD 366.14 billion, up 51.67% from April to January non-oil
imports of USD 241.41 billion in 2020–21 and up 23.86% from non-oil imports of
USD 295.61 billion in 2019–20. (Apr-Jan).
|
Statement 5: Merchandise Non-POL Non-GJ Trade in January 2022 |
|||||
|
|
Value in Billion USD |
Value in Billion USD |
|||
|
|
Jan-22 |
Jan-22 |
Jan-22 |
Jan-22 |
Jan-22 |
|
Exports |
27.09 |
22.56 |
19.79 |
20.10 |
36.92 |
|
Imports |
35.22 |
26.36 |
24.87 |
33.60 |
41.63 |
The total value of non-petroleum, non-gem, and jewellery
exports in 2021–22 (April–January) was USD 255.69 billion. This represents a
34.95% increase over the total value of non-petroleum, non–gem, and jewellery
exports in 2020–21 (April–January) and a 29.18% increase over the total value
of non–petroleum, non–gem, and jewellery exports in 2019–20. (April-January).
In comparison to non-oil and non-GJ imports of USD 205.88
billion in 2020-21(April-January) and a positive rise of 19.54% over USD 249.83
billion in 2019-20, non-oil and non-GJ imports of USD 298.65 billion in 2021-22
(April-January) represented a positive growth of 45.06%. (April-January).
|
Statement 6: Merchandise Non-POL Non-GJ Trade Apr 2021-Jan 2022 |
|||||
|
|
Value in Billion USD |
% Growth |
|||
|
|
2021-22 (Apr-Jan) |
2021-22 (Apr-Jan) |
2021-22 (Apr-Jan) |
2021-22 (Apr-Jan) |
2021-22 (Apr-Jan) |
|
Exports |
255.69 |
189.47 |
197.94 |
34.95 |
29.18 |
|
Imports |
298.65 |
205.88 |
249.83 |
45.06 |
19.54 |
In January 2022, the top 10 key commodity groupings, which account for 78% of all exports, are:
|
Statement 7: Exports of Top 10 Major
Commodity Groups |
||||
|
Value of Export (Million US$) |
Share (%) |
Growth (%) |
||
|
Major Commodity Group |
Jan-22 |
Jan-21 |
Jan-22 |
Jan-22 over Jan-21 |
|
Engineering goods |
9201.76 |
7413.15 |
27.01 |
24.13 |
|
Petroleum products |
3732.26 |
2136.00 |
10.96 |
74.73 |
|
Gems and Jewellery |
3236.98 |
2843.62 |
9.50 |
13.83 |
|
Organic and Inorganic chemicals |
2447.89 |
1942.16 |
7.19 |
26.04 |
|
Drugs and Pharmaceuticals |
2054.24 |
2075.22 |
6.03 |
-1.01 |
|
Cotton Yarn/Fabs./Madeups, Handloom
products etc. |
1389.46 |
974.54 |
4.08 |
42.58 |
|
RMG of all Textiles |
1549.00 |
1295.91 |
4.55 |
19.53 |
|
Electronic goods |
1364.63 |
1180.09 |
4.01 |
15.64 |
|
Plastic and Linoleum |
844.47 |
638.37 |
2.48 |
32.29 |
|
Rice |
813.75 |
769.89 |
2.39 |
5.70 |
|
Total of 10 Major Commodity Groups |
26634.46 |
21268.95 |
78.19 |
25.23 |
|
Rest |
7428.41 |
6269.33 |
21.81 |
18.49 |
|
Total Exports |
34062.87 |
27538.28 |
100.00 |
23.69 |
In January 2022, the top 10 major commodity groupings, which account for 75% of all imports, are:
|
Statement 8: Imports of Top 10 Major
Commodity Groups |
||||||
|
Import (Million US$) |
Share (%) |
Growth (%) |
||||
|
Major Commodity Group |
Jan-22 |
Jan-21 |
Jan-22 |
Jan-22 over Jan-21 |
||
|
Petroleum, Crude & products |
11431.59 |
9424.30 |
21.98 |
21.30 |
||
|
Electronic goods |
8216.74 |
5256.61 |
15.80 |
56.31 |
||
|
Gold |
2404.19 |
4035.23 |
4.62 |
-40.42 |
||
|
Machinery, electrical &
non-electrical |
4038.80 |
3367.71 |
7.77 |
19.93 |
||
|
Organic & Inorganic Chemicals |
2673.76 |
1983.66 |
5.14 |
34.79 |
||
|
Pearls, precious & Semi-precious
stones |
2332.04 |
2196.40 |
4.48 |
6.18 |
||
|
Coal, Coke & Briquettes, etc. |
2606.53 |
1865.66 |
5.01 |
39.71 |
||
|
Artificial resins, plastic materials,
etc. |
1762.08 |
1530.64 |
3.39 |
15.12 |
||
|
Vegetable Oil |
1858.58 |
1135.45 |
3.57 |
63.69 |
||
|
Non-ferrous metals |
1831.41 |
13.99 |
3.52 |
35.66 |
||
|
Total of 10 Major Commodity Groups |
39155.69 |
32145.65 |
75.29 |
21.81 |
||
|
Rest |
12850.22 |
9884.42 |
24.71 |
30.00 |
||
|
Total Imports |
52005.91 |
42030.07 |
100.00 |
23.74 |
||
Recent Posts
Cokion
Cokion Private Limited is an Indian multinational technology company focusing on e-commerce, technology services, online advertising & marketing, headquartered in Bengaluru, Karnataka, India. It has its subsidiary, Cokion Inc., headquartered in Albany, New York, USA.
Welcome to Cokion com., the ultimate online shopping destination tailored for the diverse needs of consumers across the world. At Cokion.com, we pride ourselves on providing a seamless and enjoyable e-commerce experience, offering a wide range of products and services to meet the unique preferences of our customers.
Key Features:
Extensive Product Selection: Discover a vast array of products ranging from electronics and fashion to home goods and more. Cokion.com curates a diverse collection to cater to every aspect of your lifestyle.
User-Friendly Interface: Our intuitive and user-friendly platform ensures a smooth navigation experience. Effortlessly browse through categories, find detailed product information, and enjoy a hassle-free shopping journey.
Secure Transactions: Your security is our priority. Cokion.com employs state-of-the-art encryption and security measures to safeguard your personal information and facilitate secure transactions.
Fast and Reliable Delivery: Enjoy prompt and reliable delivery services across the world. Cokion.com. is committed to ensuring your purchases reach you in a timely manner, enhancing your overall satisfaction.
Responsive Customer Support: Our dedicated customer support team is ready to assist you with any inquiries or concerns. Reach out to us via various channels, and we'll strive to provide swift and effective solutions.
Exclusive Deals and Promotions: Benefit from exciting promotions, discounts, and exclusive deals regularly offered on Cokion.com. Save more while enjoying the quality and convenience of our e-commerce platform.
Mission Statement:
At Cokion.com, our mission is to redefine the online shopping experience for our customers. We aim to become the go-to destination for individuals seeking quality products, exceptional service, and a platform that understands and meets your evolving needs.


